Product analytics is the act of capturing and analysing how users are interacting with a digital product or service. A product analytics tool is a type of software that captures and exposes usage patterns and insights for a digital products such as web or mobile applications. Beyond capturing simply tracking and collecting data about product usage, the real value that an analytics tool provides is the in ability to data mine this data. At a high level there a three ways to comprehend product usage through data:
Trends
Graph engagements with certain features or pages and compare it against other parts of the product over time.
Graph engagements with certain features or pages and compare it against other parts of the product over time.
Funnels
Track the levels of drop-off at each step across a specific subset of features and pages.
Track the levels of drop-off at each step across a specific subset of features and pages.
Paths
View all journeys that users take, either leading up to or following a specific interaction, as well as a measure of how common or uncommon the next step is.
View all journeys that users take, either leading up to or following a specific interaction, as well as a measure of how common or uncommon the next step is.
What product analytics is not:
- Web analytics: whose aim is the collection, analysis reporting of website data in order to improve the web user user experience.
- Marketing analytics: the process of leveraging data to evaluate the effectiveness of marketing campaigns and strategies
- Business intelligence data: is the act of brining together all of an organisation data in order to generate business insights.
Before collecting analytics, the Product manager must identify which analytics to capture, to get started the product manger can ask themselves the following questions:
- How can we ensure that our users are successful with our products?
- What's blocking users from getting value form our products?
- How can we add value to the product that users are willing to pay for?
- Are we building products and features that users want and need?
In the past product manager answered the above questions through a combination of asking questions and intuition, today with product analytics these answers can be found in data, the question is what data, how to collect it, and where to analyse it. Product analytics aims to support intuition with evidence based decision making. Product analytics doesn't replace qualitative data, it augments it with quantitative facts. Helping maximise valued on product decision making.
Quantitative data can tell you what a user did, Quantitative data tells you why they did it. The combination of the two are what a product manager needs to make informed decisions from.
Product analytics tools generally capture two high level types of data:
- Events: any user action in software applications
- Clicks
- Slides
- Gestures
- Play commands
- Downloads
- Text field input
- Event properties: the specific attributes of the tracked interactions.
- Device
- software version
- custom attributes
Tracking and reporting
At it's heart product analytics boils down to tracking metrics and providing visibility of tracked metrics. These metrics need to be tracked at the individual user level as well as the segment level, that is to say for B2B businesses, the individual interactions are important however it's essential to ensure that the organisation you are serving is finding the value they are paying for.
Key product analytics definitions:
- Acquisition: refers to the process of gaining new users of your product. Teams can use product analytics to track acquisition via metrics like new user signups and logins.
- Cohort: a subset of your user base. Cohorts typically have a time component to them, for example your August Cohort of new users. There are also behavioural cohorts, which are essentially the same thing as segments.
- Engagement: this tracks how users interact with an application at the most granular level. You can measure Product engagement with a variety of metrics, for example using Adoption, Stickiness, and time spent in-app.
- Event: An action a user takes within a software product. Some generic examples of events are: Share Dashboard, Select Option, Change View, and Enter New User.
- Funnel analysis: a measurement of how customers move through a defined series of steps in your application. This helps provide clarity as to where users drop off when following these steps, and where they go from that drop-off point.
- Growth: a measure of the net effect of your user acquisition and retention efforts. A product and company achieves growth by adding new customer accounts or by increasing usage within existing customer accounts (or ideally, both).
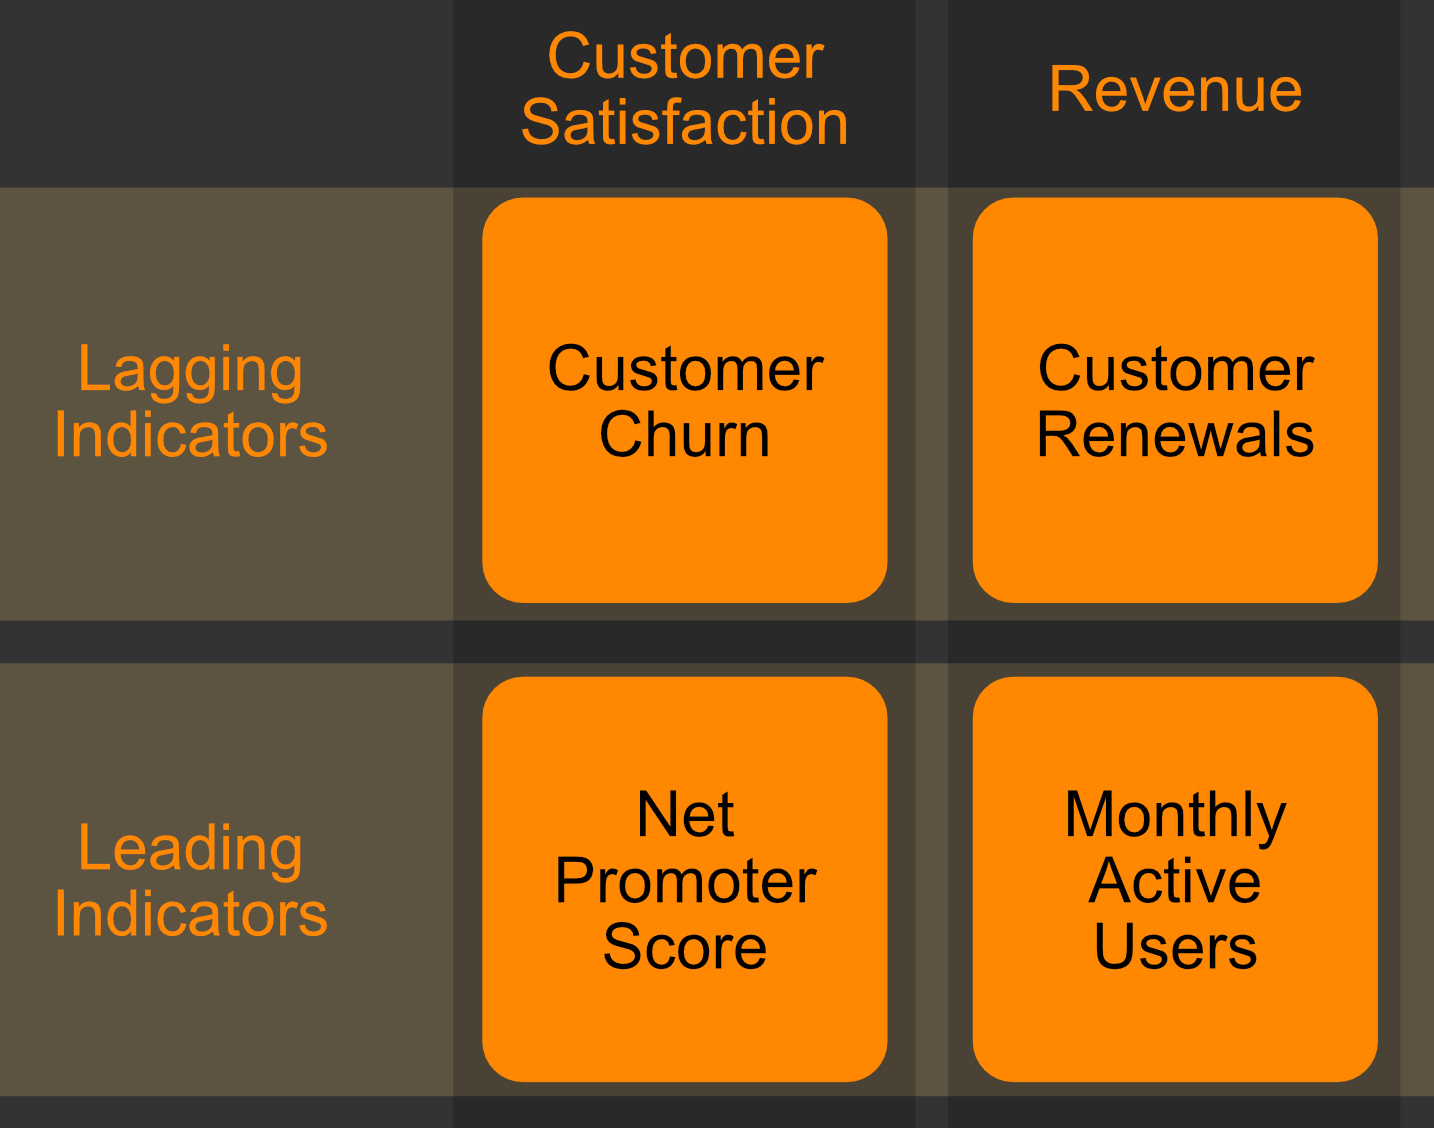
- Lagging indicators: metrics that you want to move for the health of the business , but may be harder to see results in a short timeframe.
- Leading indicators: metrics that are measurable in a shorter timeframe, and have a high probability of affecting your lagging indicators.
- Metrics: are a standard of measurement by which efficiency, performance, progress, or quality of a plan, process or product can be assessed.
- Path analysis: a visualisation of what users are doing before or after using a specific page or feature in your application, shown as the sequence of actions that users took before or after the target event.
- Product adoption: also referred to as activation, this measures when users understand your product’s value and perform certain actions, for example engaging with key features and moving through account setup workflows.
- Retention: the percent of users or customer accounts still using your product after they initially install or start using it. Another way to understand if users are continuously engaging with your product is with Stickiness, which measures how many users return to the product on a regular basis.
- Segment: A subset of users that share a common characteristic, or multiple common characteristics.
Product analytics strategy
Track everything is not a valid strategy, before you decide what to track you must decide what you want to know. Start with an objective, then work your way back to the granular data that you need to collect. Once you understand what you want to know, identify what you information you need to gain insights to your objective, then identify the metrics you need to gain those insights. Some common strategic goals could be:
- Understand user: in order to build the right products and features
- Reduce friction: simplify the use of a product or feature by optimising it to usage patterns
- Increase revenue: leverage analytics to identify opportunities for customer expansion or comprehend granular ROI per feature.
- Drive innovation: Gain insights in the direction you should take your product based on usage.
The take away is to identify specific objectives, and then work your way backwards to the data you need to support those objectives.
Metrics
Metrics are the evidence we use to gauge the quality of our product from various dimensions:
Baseline usage
- How many active users do I have today, and in the last week and month?
- How do users get around my product? (what's the user journey map)
- Which features do users engage with the most?
- Are users finding important features of the product quickly and easily?
- Is usage of key features increasing or decreasing?
- Which features and pages are users having challenges with?
- Which features do users ignore?
- How frequently are active users coming back? (understand usage cadence by segment)
- How many users continue using my within the first months?
- How many users who interact with a key feature come back?
Performance
- How quickly is data served to the user?
- How many bugs does our product have?
Value
- How many paying customers do we retain per billing cycle?
- At what rate are we loosing paying customers?
- At what rate are we gaining new customers?
Though there can be dozens of metrics and supporting dimensions which we could capture, there are three primary metrics that all organisations are going to want to understand.
Business outcomes
Represents how your product impacts key business and financial outcomes in both the short and long term.
Represents how your product impacts key business and financial outcomes in both the short and long term.
Product usage
reflect how users behave inside your product, which features are most used or suffer from friction
reflect how users behave inside your product, which features are most used or suffer from friction
Product quality
measure how well does your product technically work, response time, bugs per feature, and so on.
measure how well does your product technically work, response time, bugs per feature, and so on.
There are Lagging and Leading indicates, lagging indicators measure past performance, they inform you how your product was doing in the past. Lagging indicators are those which you want to move for the health of the organisation, they are difficult to understand in the short term. Leading indicators on the other hand can be measured in a shorter time frame and have a high probability of influencing your lagging indicators. Leading indicators inform you of future performance.
Not only is it not valuable to measure everything, it's also not feasible, this is why as a product manage you must strategically choose the metrics that will provide you with valuable insights. The SMART framework is an excellent rubric to help focus on the metrics that matter most to the organisation.
- Specific: Choose an object with a numeric goal in mind
- Measurable: Ensure that your metric is quantitative in nature
- Actionable: Ensure that each metric can lead to an action
- Relevant: Your metrics should tie back into your objectives
- Timely: A balance of leading and lagging indicators, measure progress over time & understand performance.
For example
Goal
Upsell freemium users to premium accounts
Upsell freemium users to premium accounts
Strategy
Target heavy users with in-app discounts to incentivise upgrade
Target heavy users with in-app discounts to incentivise upgrade
Product outcome
Users receive in-app notifications of limited time preferred pricing
Users receive in-app notifications of limited time preferred pricing
Metrics
Track between regular upgrade patterns vs incentivised patterns
Track between regular upgrade patterns vs incentivised patterns
Identifying metrics frameworks
OKRs (Objectives and key results)
Is a goal-setting framework utilised by organisations to align teams and individuals with overarching objectives and measure progress effectively. Objectives are high-level, inspirational goals, while Key Results are specific, measurable metrics that define success.
KPI's (key performance indicators)
Key Performance Indicators (KPIs) are quantifiable metrics used by digital organisations to evaluate and measure various aspects of their performance and success over a period of time. These metrics provide valuable insights into how well the organisation is meeting its goals and can help inform decision-making and strategy.
One metric that matters
(OMTM) is a strategy in which an organisations or team identifies a single key performance indicator (KPI) that is most closely aligned with its primary objective or core goal, and focuses intensely on tracking and optimising that particular metric.
North star metric
The "North Star Metric That Matters" concept is a strategic approach in which an organisation or team identifies a single, central metric that represents the core value it delivers to its users and aligns all efforts and objectives around optimising that metric over a period of time. Unlike (OMTM) the North star metric is composed of numerous sub-metrics, much like the customer health value.
Check metrics (balance metrics)
Ensure that you are not focusing too much on a particular metric. Check metrics can be thought of a sanity check to ensure that your primary metrics are not obfuscating an underlying issue your product may be suffering from.
Mapping your North star metric
- Start with mapping your product's vision, what is it's future direction
- Define what you'r products immediate goals & priorities are?
- Identify a North Star metric which you can use to measure the core value of your product.
- Identify how is the North star metric is calculated, what underlying data and what proportions do you they represent.
- How does your North Star align with your immediate goals & priorities.
- List two to five leading indicators that you can track that are likely to cause movement in your North star.
- Identify any potential consequences of strengthening your north star metric which may be in conflict with your long term vision.
- Leverage check metrics to observe potential consequences of increasing your North star metric.
Product analytics hierarchy of needs
This is a simple step-by-step hierarchy, to get the right data, properly analyse it then leverage it to bring real change to your organisations decision making and product development processes.

Collect data
this is the last thing you define when establishing a data strategy, but the first thing you need to your hierarchy. Raw data is the foundation of Data analytics. In the Data analytics context data comes in two related forms:
- Data about the people who use the product
- Visitors
- Accounts
- Segments
- User metadata
- Data about how they use the product
- Events
- page loads
- Clicks
- Feature usage
Refine data into metrics
The second step is to transform your raw data into more meaningful metrics:
- Breadth: A measure of how many total users you have, as well as how many users you have per account.
- Depth: How much of the product your customers are using specifically how many key features of the product They're utilising.
- Frequency: How often are users log into your product in a given time frame.
What is meaningful metrics is context specific to the organisation as well as the product, generally it is recommended to leverage a smaller number of clear metrics that are easily measured and align to the teams you work with around a central impactful objective.
Build metrics into reports
Build reports from your metrics, establish tables and graphs that describe or compare user behaviour over time:
- Track how metrics fluctuate over time
- Identify areas of improvement
Paths: visualisations of what users are doing before or after using a specific page or feature in your application, shown as the sequence of actions that users took before or after the target event.
Funnels: a measurement of how customers move through a defined series of steps in your application. This helps provide clarity as to where users drop off when following these steps, and where they go from that drop-off point.
Retention: are people using the product over time, are they coming back to the product
Take action
Now that your metics are visible through reports you can turn information into action based on tangle data, you are now able to make evidence based decisions.

In order to champion action throughout the organisation the product manage must steel themselves with various weapons to champion change through action.
Tool #1 Analysis
- Review the data you have
- Question the results
- Formulate hypothesis
- Validate your hypothesis.
Tool #2 Share
- open you data
- share your insights,
- leverage a organisational facing dashboard
Tool #3 Storytelling
- Data & insights benefit from a story, what are they saying?
- Share insights in a slide deck
- Contextual information
- Logic
- User quotes
- Supplemental data
At the end of the day Reports are good, but if you do not take action on the insights gained from them they are of limited value.
Data actualisation
Data actualisation is less of a step and more of a state of being, it is the result of hard work and advocacy. Once your organisation has reached this level they are truly a data informed organisation which leverages:
- Accurate, clean and actionable date
- Ability to ask and answer progressively more difficult questions.
- You'll only use intuition as a starting point, and will be able to validate with metrics